
REsults

Particle Detection in Model Tissue Phantoms and Biological Tissues (WP4)

Work Package 4

Detecting nanoparticles in tissues through correlative imaging

WP4 developed and evaluated workflows to identify, localise and compare inorganic nanoparticles in tissue phantoms and biological tissue models. By connecting optical, elemental and chemical imaging methods, the work examined how complementary views of the same sample can be combined into stronger spatial evidence.

One key lesson A convincing image is not automatically a comparable measurement. The biological question, sample, method sequence, image registration and calibration strategy must be designed as one workflow.
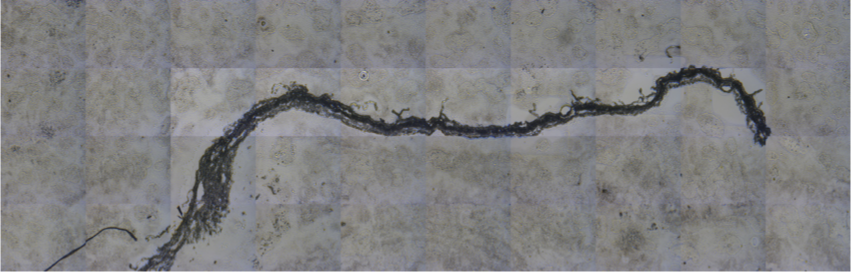
One tissue region viewed through three complementary imaging approaches and combined into an aligned composite
WP4 at a glance
2public deliverables available on Zenodo
3core techniques in the controlled correlation
1internal interlaboratory comparison
1Academy replay with practical guidance
01

Our results From controlled phantoms to evidence in biological matrices

Flagship result

Correlative localisation and distribution across increasing sample complexity

WP4 first compared complementary signals under controlled conditions, then examined what remained measurable in three-dimensional models, tissue sections and single-cell systems.

The strongest contribution is not one universal image or method. It is a practical evidence chain showing how sample complexity, signal mechanism, spatial resolution and method order shape what can be claimed.
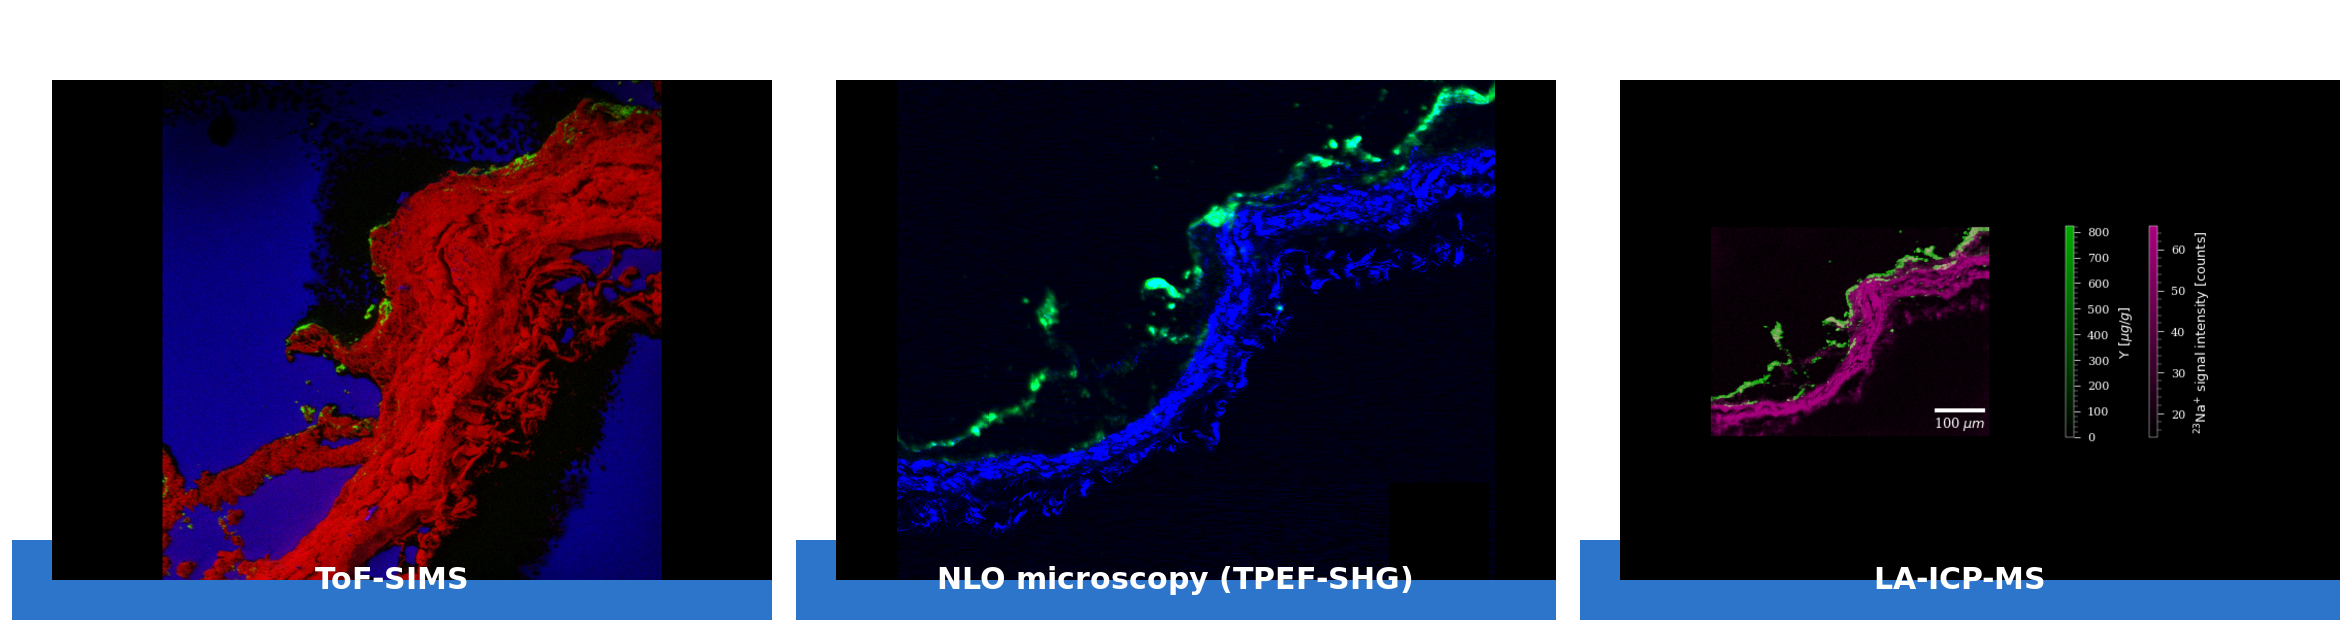
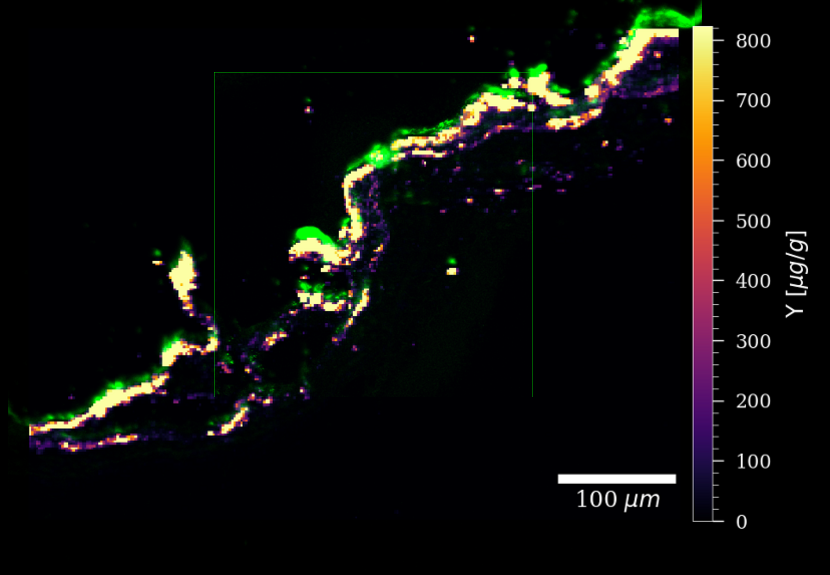
Same ROI in UCNP-spiked 3D tissue imaged by ToF-SIMS, NLO TPEF-SHG microscopy and LA-ICP-MS
ROI 2 of an OCT-embedded 3D engineered tissue model seeded with A549 cells and spiked with UCNPs-A, imaged by ToF-SIMS, NLO (TPEF-SHG) microscopy and LA-ICP-MS. Adapted from METRINO Academy 4, slide 19. Measurements: RISE, INRiM and UGent; sample preparation: OVGU; UCNPs: BAM.
Internal interlaboratory comparison (ILC)

Comparing complementary methods on shared reference samples

Within the WP4 internal ILC, participating laboratories compared results generated with complementary imaging and mass-spectrometry methods on common UCNP-containing phantom samples. Related studies then explored how these approaches performed in 3D tumour models, HfO₂-containing tissue sections and A549 cell systems, while keeping the limits of each method explicit.

UCNP calibrator phantoms3D tumour modelsHfO₂ tissue sectionsA549 cells
TPEFOptical mapping of fluorescent signals
ToF-SIMSChemical and spatial surface information
LA-ICP-TOF-MSQuantitative elemental mapping
SEM-EDXMorphology and elemental identification
scICP-MSSingle-cell mass quantification
Exploratory methodsIncluding µCT, SAXS, Raman and fluorescence microscopy
Resources

Protocols and interlaboratory evidence

D7 consolidates protocols for biological sample preparation and nanoparticle measurements in cells and tissues. D8 documents the internal comparison of approaches for nanoparticle identification, localisation and quantification in tissue-phantom samples.

Deliverable D7Protocols

Preparing tissues and tissue phantoms, and measuring nanoparticle uptake and distribution

Published on ZenodoVersion 1 · CC BY 4.0
What will you find in D7?
  • Preparation approaches for tissue phantoms and selected biological models.
  • SOPs covering uptake, quantification and spatial-distribution measurements.
  • Practical links between sample preparation, measurement method and intended claim.
Document type: SOP repository and reportVersion: 1Published: 30 April 2026DOI: 10.5281/zenodo.21537147Licence: CC BY 4.0
How can you use D7?
  • Start with controlled samples before moving to more complex tissues.
  • Match preparation and method order to the spatial or quantitative question.
  • Identify steps that require local adaptation and re-verification.
From workflow design to shared regions of interestThese Academy 4 visuals make the D7 preparation and sequencing logic tangible.
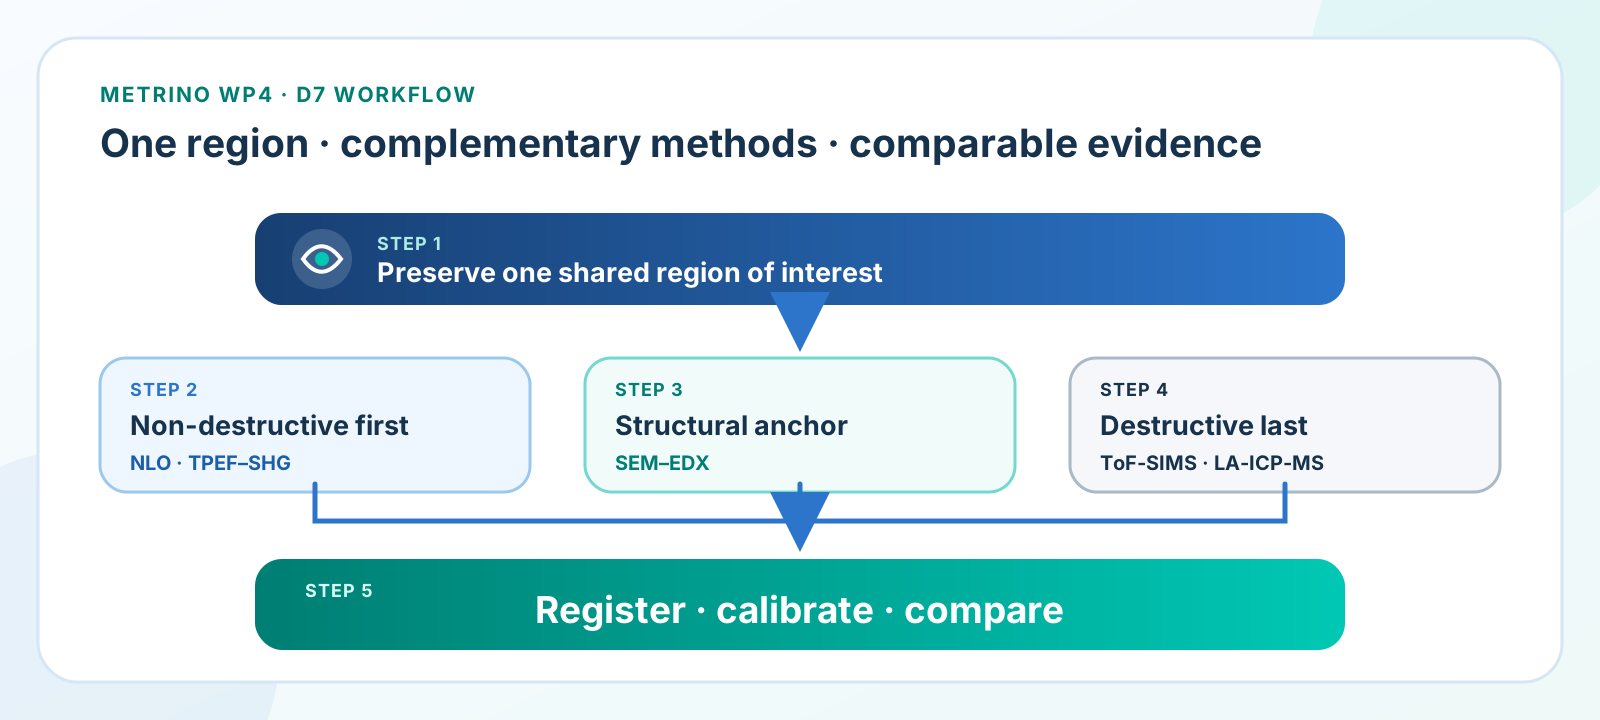
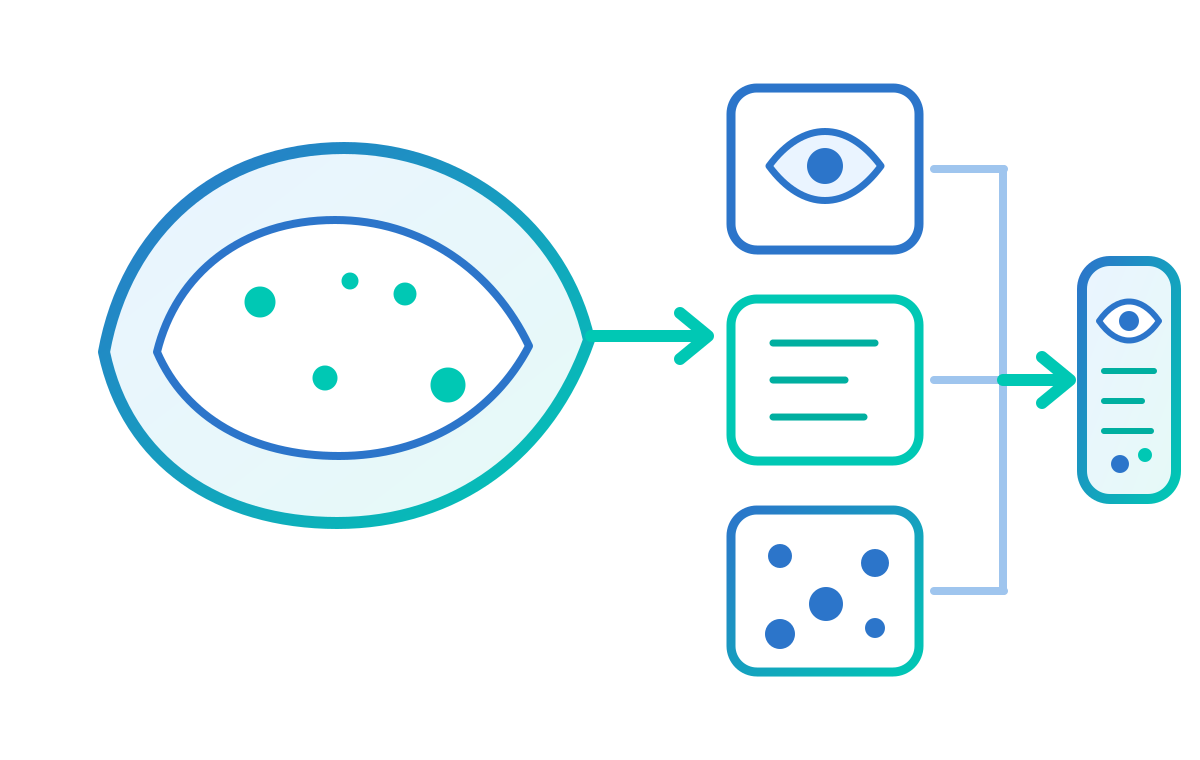
Simplified correlative-imaging workflow from one shared region of interest to registered, calibrated and compared images
Conceptual workflow for a shared region of interest—not an experimental-data figure. Adapted from METRINO Academy 4, slide 5; Leonardo Mortati, INRiM.
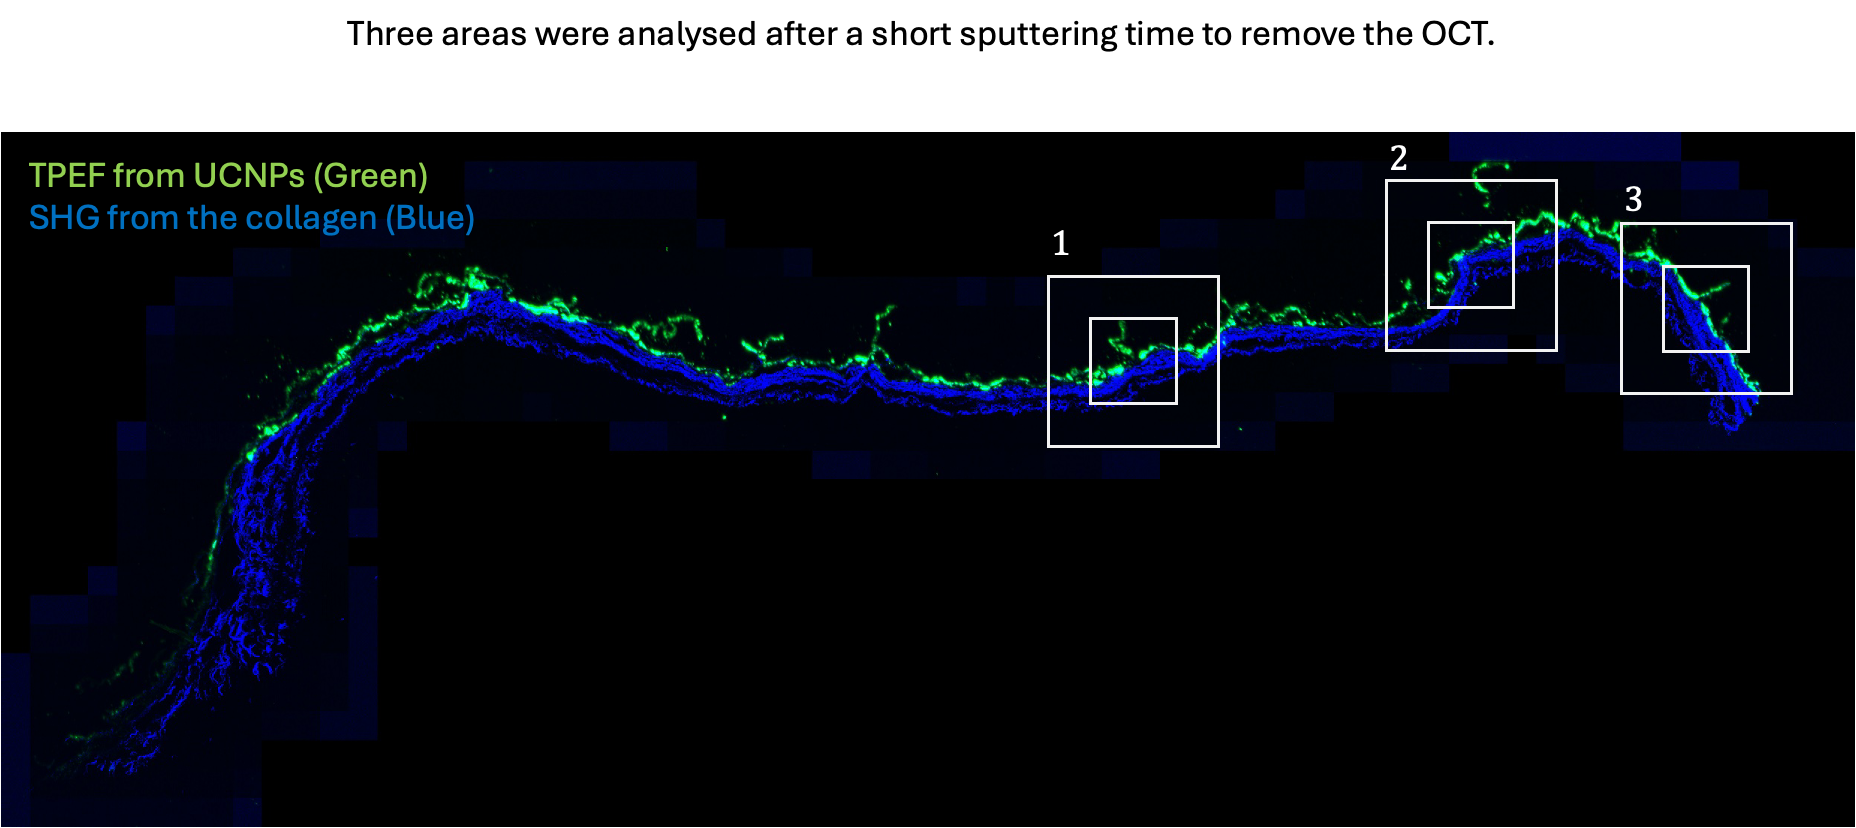
NLO TPEF-SHG mosaic of UCNP-spiked 3D tissue with regions selected for ToF-SIMS and LA-ICP-MS
NLO mosaic of the UCNP-spiked 3D tissue section with regions selected for ToF-SIMS and LA-ICP-MS. Source: METRINO Academy 4, slide 18. NLO: INRiM; subsequent measurements: RISE and UGent.
Deliverable D8Interlaboratory study

Comparing nanoparticle identification, localisation and quantification

Published on ZenodoVersion 1 · CC BY 4.0
What will you find in D8?
  • The design and execution of the internal WP4 comparison.
  • Evidence from complementary techniques applied to controlled and selected biological systems.
  • Lessons on alignment, sensitivity, matrix effects and quantitative interpretation.
Document type: Internal ILC reportVersion: 1Published: 30 April 2026DOI: 10.5281/zenodo.21641447Licence: CC BY 4.0
How can you use D8?
  • Design comparisons around differences in measurand, scale, resolution and contrast mechanism.
  • Plan image alignment, calibration and data extraction before acquisition.
  • Use documented limitations to select fit-for-purpose methods without extending conclusions beyond tested systems.
From registration to quantitative comparisonAlignment diagnostics and matched signals show how different imaging modes were made comparable without implying that they measure the same quantity.
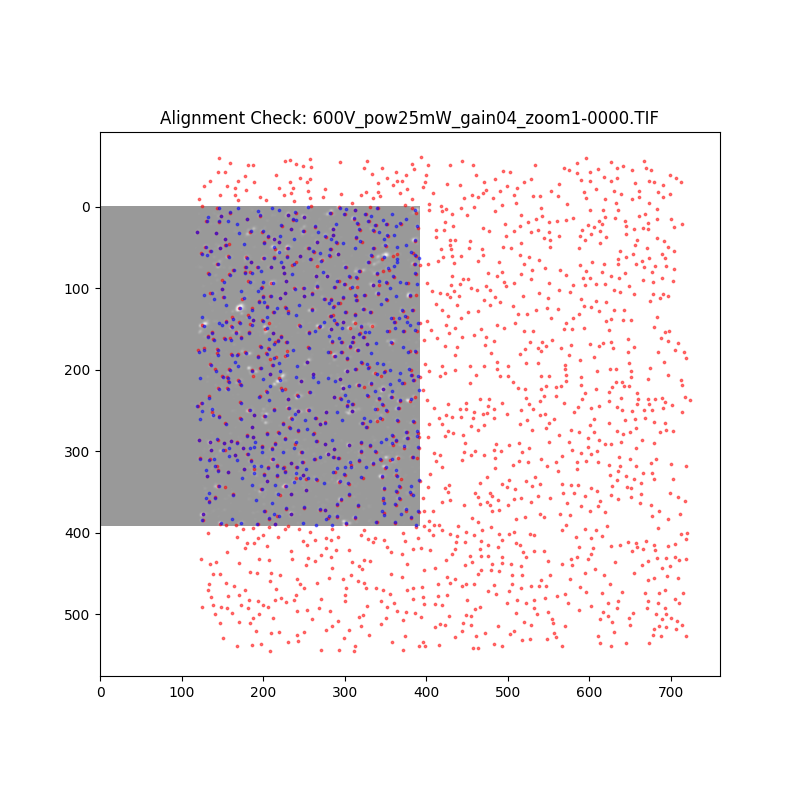
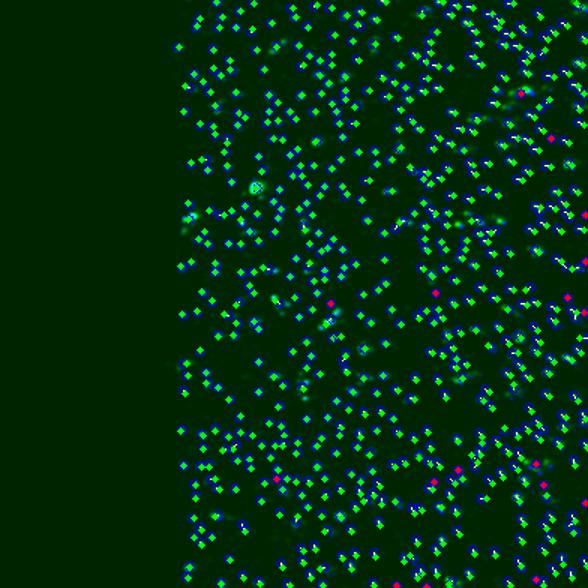
Centroid map showing TPEF and LA-ICP-MS particle coordinates and their overlap after automatic alignment
Automatic alignment using extracted centroids and an overlap check between TPEF and LA-ICP-MS data. Source: METRINO Academy 4, slide 14; analysis described in public Deliverable D8.
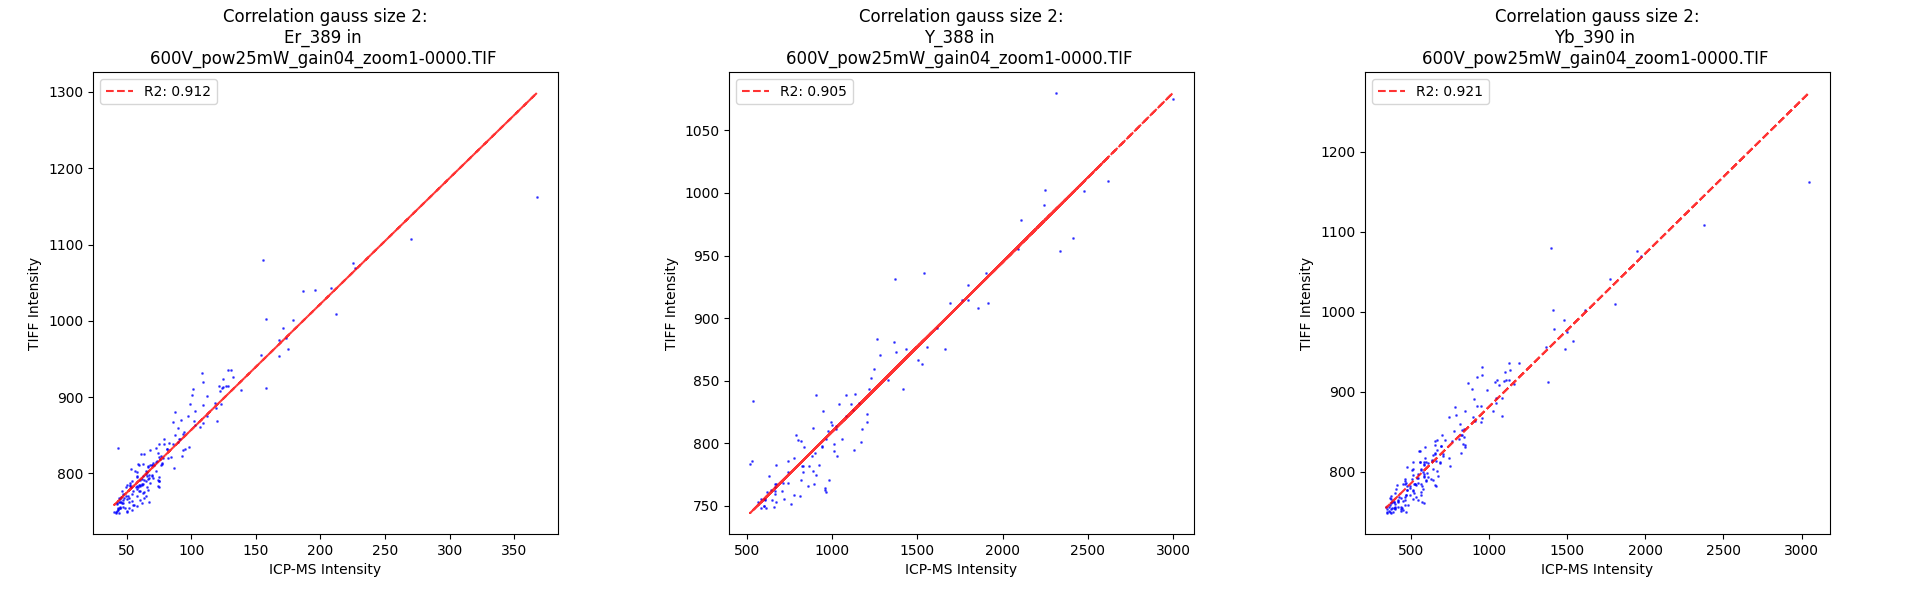
Three scatter plots comparing TPEF intensity with LA-ICP-MS signals for erbium, yttrium and ytterbium channels
Examples of quantitative comparisons between TPEF intensity and LA-ICP-MS signals for Er, Y and Yb. Source: METRINO Academy 4, slide 15. These plots relate to, but are not identical to, the final D8 figures.
Overlay of TPEF and LA-ICP-MS Yb data showing matched particle centroids, displacement vectors and outliers
Matched TPEF and LA-ICP-MS Yb data with centroid-pair displacement vectors. Source: public METRINO Deliverable D8, Figure 9. TPEF: INRiM; LA-ICP-MS: UGent; calibrator: Empa; UCNPs: BAM.
02

Learn from the experts How to plan correlative imaging before the first image is acquired

Plan from the evidence backwards

Correlative imaging starts with one question, not a collection of instruments. Four connected decisions determine whether different views can ultimately be compared.

Start hereWhat must correlative imaging reveal?
Define the claim

Is the goal to detect, localise, quantify, identify chemistry or understand tissue context?

Select the model

Choose controlled phantoms, 3D models, tissue sections or cells according to the evidence required.

Protect the shared sample

Sequence methods so early measurements do not remove or alter information needed later.

Prepare the comparison

Define landmarks, regions of interest, calibration, data formats and reporting before acquisition.

Academy 4 makes these decisions tangible by showing why one spot can generate several valid but different views — and why alignment remains one of the hardest practical steps.

METRINO Academy

One Spot, Many Eyes: Standardising Correlative Imaging

Presented by Dr Leonardo Mortati, INRiM.

  • Why techniques reveal different information from the same sample.
  • How acquisition order and image registration affect interpretation.
  • Why visual detection and quantitative measurement are not equivalent.
“Correlative imaging could be a powerful solution…”
Dr Leonardo Mortati, INRiM — Academy 4
84%of final-poll respondents said they would be likely to use a standardised correlative-imaging workflow if practical guidance were available.
03

What WP4 taught us What the experiments showed — including where methods reached their limits

WP4 treated sample preparation, method order, registration and interpretation as one connected measurement problem. Its value lies both in the successful correlations and in the limitations observed.

01

Controlled phantoms separate method performance from biological complexity

Known-content systems provide a necessary baseline before signals are interpreted in tissues or cellular models.

02

Biological matrices can obscure otherwise detectable signals

Autofluorescence, surface roughness, background and sensitivity can change whether detection or quantification remains feasible.

03

Orthogonal techniques do not measure the same thing

Optical, elemental and chemical approaches contribute different measurands and spatial scales; complementarity is not numerical equivalence.

04

Not every tested method belonged in the quantitative core

Documenting when a method supports detection, localisation or quantification is part of trustworthy metrology, not a result to hide.

Operational limits are a result.

Exploratory work with additional tissues and techniques revealed cases where matrix overlap, nonspecific fluorescence, insufficient sensitivity or resolution prevented robust quantitative interpretation. Those boundaries help future users choose methods more realistically.

04

From results to community use How to use the WP4 results in practice — and what should come next

Three practical ways to use the WP4 results

  • Plan the full workflow before collecting images. Use D7 and D8 to define the scientific claim, select the model, sequence the methods and prepare landmarks, regions of interest, calibration and reporting from the outset.
  • Interpret each view within its evidence limits. Use the tissue-phantom and biological-matrix findings, together with Academy 4, to distinguish detection, localisation, chemical identification and quantification — and to recognise when a method cannot support the intended claim.
  • Build the next comparisons and guidance. Use the internal ILC, SOPs and tissue-phantom experience to design comparable external studies and inform future protocol harmonisation, while keeping the validated scope and observed limitations visible.
WP4 scientific contact
Dr Leonardo Mortati

Dr Leonardo Mortati

WP4 leader, INRiM

Scientific contact for the WP4 work on tissue phantoms, correlative imaging, internal comparison and nanoparticle localisation in complex biological samples.

Built through collaboration

Organisations contributing models, materials, methods, measurements or scientific guidance to D7 and D8

The grid reflects organisations documented as contributors to D7 and D8.

Metrology for Innovative Nanotherapeutics
Get Social

The METRINO project has received funding from the European Partnership on Metrology (Grant #22HLT04), co-financed from the European Union’s Horizon Europe Research and Innovation Programme and by the Participating States. Views and opinions expressed are however those of the author(s) only and do not necessarily reflect those of the European Union or EURAMET. Neither the European Union nor the granting authority can be held responsible for them.

© 2026 — The METRINO Project